Power BI for finance teams
A board-ready P&L in Power BI — without the six-week project.
Start with the free Profit & Loss Statement today. When you’re ready for the whole picture, the Financial Clarity Suite ties out to the cent on your own G/L — finished dashboards, you just connect your data.
Inside the dashboard
Here’s exactly what you’re looking at.
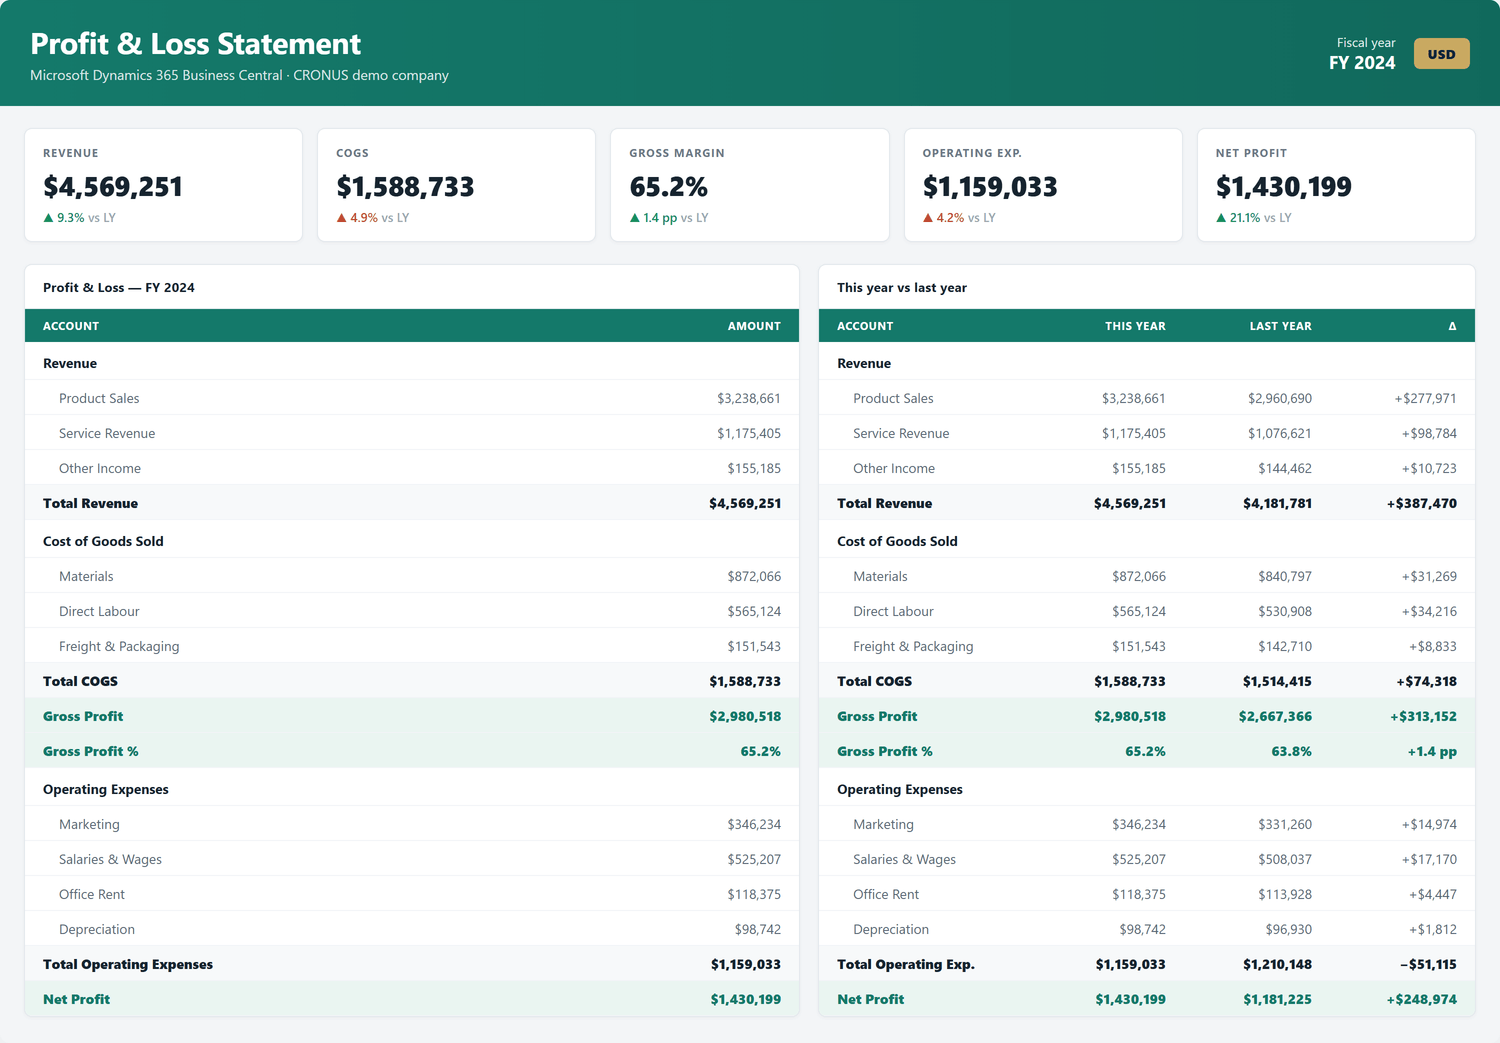
A board-ready Profit & Loss in Power BI — the same statement your accountant produces, live on your own Business Central data.
The numbers a board asks for first
Revenue, COGS, Gross Margin %, Operating Expenses and Net Profit across the top — each with the movement versus last year. One glance and you know how the period went.
The full P&L, two years side by side
Every line from Revenue down to Net Profit, this year next to last year with the variance. Driven by production-grade DAX — not a frozen Excel export.
And here’s what you do with it
Switch the period, compare to last year or budget, and click into any account to see what moved. Every figure reconciles to your G/L — to the cent.
Most finance teams wait weeks for a P&L that should take an afternoon.
A custom Power BI finance build runs weeks and $10k–$35k. The data was always there — what was missing was a model that reads it and ties out. That’s all this is.
Two ways to start
Try it free. Buy it when it’s obvious.
The free starter proves the approach on sample data. The Suite does it on yours, tied out to the cent.
Start here
The Profit & Loss Statement
Free · download in under a minute
- Working .pbix file with sample G/L data
- 12 starter DAX measures — YTD, MTD, YoY, variance
- Sample chart of accounts (CSV) to plug in
- Step-by-step installation guide (PDF)
- No course, no subscription, no spam
Self-serve suite
The Financial Clarity Suite
$997 founding · $3,750
- Five packs: P&L, Balance Sheet, Cash Flow, AR/AP, Cockpit + more
- Runs on your BC — tables 15/17/96 (CSV or API)
- Tie-out validator: reconciles to the cent, built in
- Full .pbip + .pbix source files, no lock-in
- The Steering Playbook · 14-day refund
Why it’s different
Built like an auditor would.
Ties out to the cent
Every reported number reconciles to source G/L. A hard gate, not a hope.
One SWITCH engine
A single measure drives the whole statement. Auditable, fast, no 40-measure spaghetti.
You own the files
Full .pbip + .pbix delivered to your tenant. No black box, no vendor cloud.
The tie-out is the whole point
Every figure reconciles to your Business Central G/L — to the cent. The same model and measures the full Suite is built on. Open the free Profit & Loss Statement and check it yourself.
See it reconcile →Reconciliation check
Illustrative — the validator runs this check on your own G/L on every refresh.
Start with the free file.
Open it in Power BI today. Decide about the Suite when the numbers prove themselves.
Get the free Profit & Loss Statement → Or skip ahead to the Financial Clarity Suite